
Work · Case study
B1G+A: live Big Ten analytics, built in‑house.
Live and still buildingA live analytics platform for Big Ten football, designed, built and run by ABA.
See it
What B1G+A does
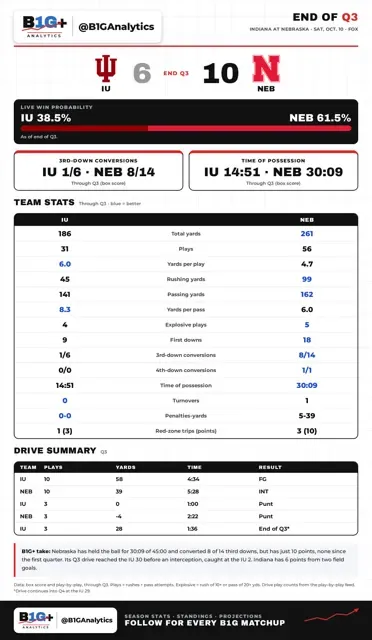
Fresh captures of the live site. Swipe or use the arrows.


Projections are just that: projections. Model estimates built from the data, not guarantees.
By the numbers
Real numbers, from the platform itself.
Read straight from B1G+A’s own data. Anything we can’t verify yet is marked, not guessed.
- 138FBS teams ratedEvery FBS team in the B1G+A Power Rankings
- 510completed games modeled2026 FBS results feeding the ratings
- 140games graded play-by-playWeeks 1–7, 4th downs graded
- 54reports & cards publishedLive game updates, previews and results
- 5 seclive win-chance refreshDuring games, on the Live Tracker
- 4model versions shippedSince launch on Oct 9, 2026
- 8,585URLs mappedPages, data files and shared links
- Still buildingSite traffic
- Coming soonProjection track record
Figures as of Oct 19, 2026, from B1G+A’s published data. They grow as the season goes on.
What we built
- Live win probabilities that move with the game.
- Power rankings built from the model, not opinion.
- Projections for games, bowls and the College Football Playoff.
- Updates as news breaks: injuries and announcements flow into the numbers.
- A live play-by-play tracker for in-game analytics.
Projections are just that: projections. Model estimates built from the data, not guarantees.
Why we built it
To prove the engine. College football throws off an enormous amount of data, all season, in real time: scores, play-by-play, injuries, news. We wanted to take all of it, track it, measure what matters, and project what happens next, while it’s still happening.
It’s the same approach we bring to every client. The subject changes (your people, spend, processes and customers), but the engine is the same: messy, fast-moving data turned into numbers you can act on.
Why build a whole live sports analytics platform just to show that?
Because we could.
Start here
Start with an Organizational Velocity Review.
Send us the data you already have. We’ll show you where you’re moving, where you’re stuck, and where things are broken, in reports that are easy to read. Starting at $2,500. No build required.